 |
|
|
|
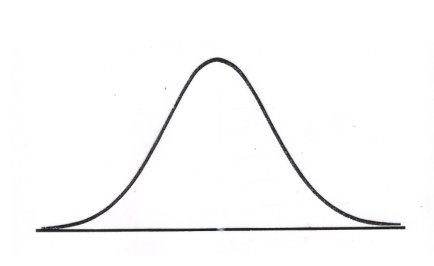
Standardized Testing is a major issue in today's schools. The No Child Left Behind act has brought high-stakes testing and accountability to the forefront, for better or for worse. Therefore, this is an issue that all teachers should be well versed in. Many of the same principles from the section on Assessing Student Learning, including the RSVP characteristics and norm- v. criterion-referenced assessments, are applicable in this discussion, as well. Another major topic in this section is the interpretation of standardized test scores. How Standardized Scores are Obtained When a standardized test is created, the organization creating it gives the test to a large representative sample of the target population (e.g., 5,000 4th grade students from different areas of the country, different socioeconomic backgrounds, different ethnic backgrounds, different achievement levels, etc.). The scores obtained by this sample are then graphed and typically end up in a normal curve (we won't go into statistics here) that looks something like this:
An average, or mean, is computed for the scores (that's the center mark), and then a standard deviation (or the average amount scores tend to vary from the mean) is also computed. As a general rule, 68% of all of the scores fall within 1 standard deviation of the mean, 95% of all scores fall within 2 standard deviations of the mean, and 98% fall within 3 standard deviations of the mean, as shown:
This curve can then be used to "standardize" the scores. There are several different types of scores, however. Raw Scores The most basic scores you can get are raw scores, which simply tell you how many questions a student answered correctly. These can be easily converted to percentages. For example, Johnny answered 85 out of 100 questions correctly, or 85%. This is an example of a criterion-referenced score because it does not compare Johnny's score with that of any other students. However, it is not very descriptive. Raw scores are not standardized. Percentiles Most of us are familiar with percentiles and can interpret them fairly easy, but we still have to be careful. For example, a percentile score of 85 means that Johnny did better on the test than 85% of his peers. This shows us that Johnny is doing well above average. However, percentile scores cannot show us improvement from year to year. They are not standardized, so they cannot be added and subtracted across years. Thus, a percentile score of 85 one year and 89 the next year does not necessarily show improvement. Percentiles are not standardized, but they are norm-referenced because they compare students. Stanines Stanines, or standard nines, are the first of our standardized scores. Using statistics, test makers break the normal curve up into 9 segments with a mean of 5 and a standard deviation of 2. Scores are then converted to fit within these divisions. Therefore, someone who does very well on a test may get a stanine of 8 or 9 where someone who does poorly may get a stanine of 1 or 2. Average students would score between 4 and 6. Because these scores have been standardized, they can be subtracted from year to year. Therefore, if Johnny gets a 6 one year and an 8 the next, we can say that he is improving. Grade Equivalent Scores Grade equivalents are popular, but often misinterpreted. For example, 4th grader Johnny may get a grade equivalent score of 8 on his reading comprehension test. What does that mean? Does it mean he is reading at an 8th grade level and should go to 8th grade for English? Not at all. It means that Johnny comprehends 4th grade material as well as an 8th grader would - in other words, his reading comprehension skills are strong. These scores are also norm-referenced and comparative, but not standardized.
QUESTIONS:
|